
Visualization Maps of Technology as a Social Marker of Race, Class, & Economics in Rochester, NY
Phase III of my project will be to create maps once I have photographed the locations of the 1,455 payphones in the Greater Rochester Region (Monroe County, NY.) These maps will show the locations of the payphones and their functional status overlaid on-top of plotted visual data information. Each map will have unique visual data that is beneath the surface of the payphone locations. The visual data categories will include: Census data (ethnicity, economic, change in economics, population density, & more) & Police Data (all criminal activity, shootings, robberies, domestic violence.) The visualization with the maps will help viewers to better understand the makeup of the individuals utilizing the payphones as a lifeline without providing any portraits. In the end, I hope the mapping will help viewers to understand how we use social markers to make preconceived judgments of areas of our city.
Rough Draft of Map Comparing Locations of Payphones to Census Data for the Greater Rochester, NY Region
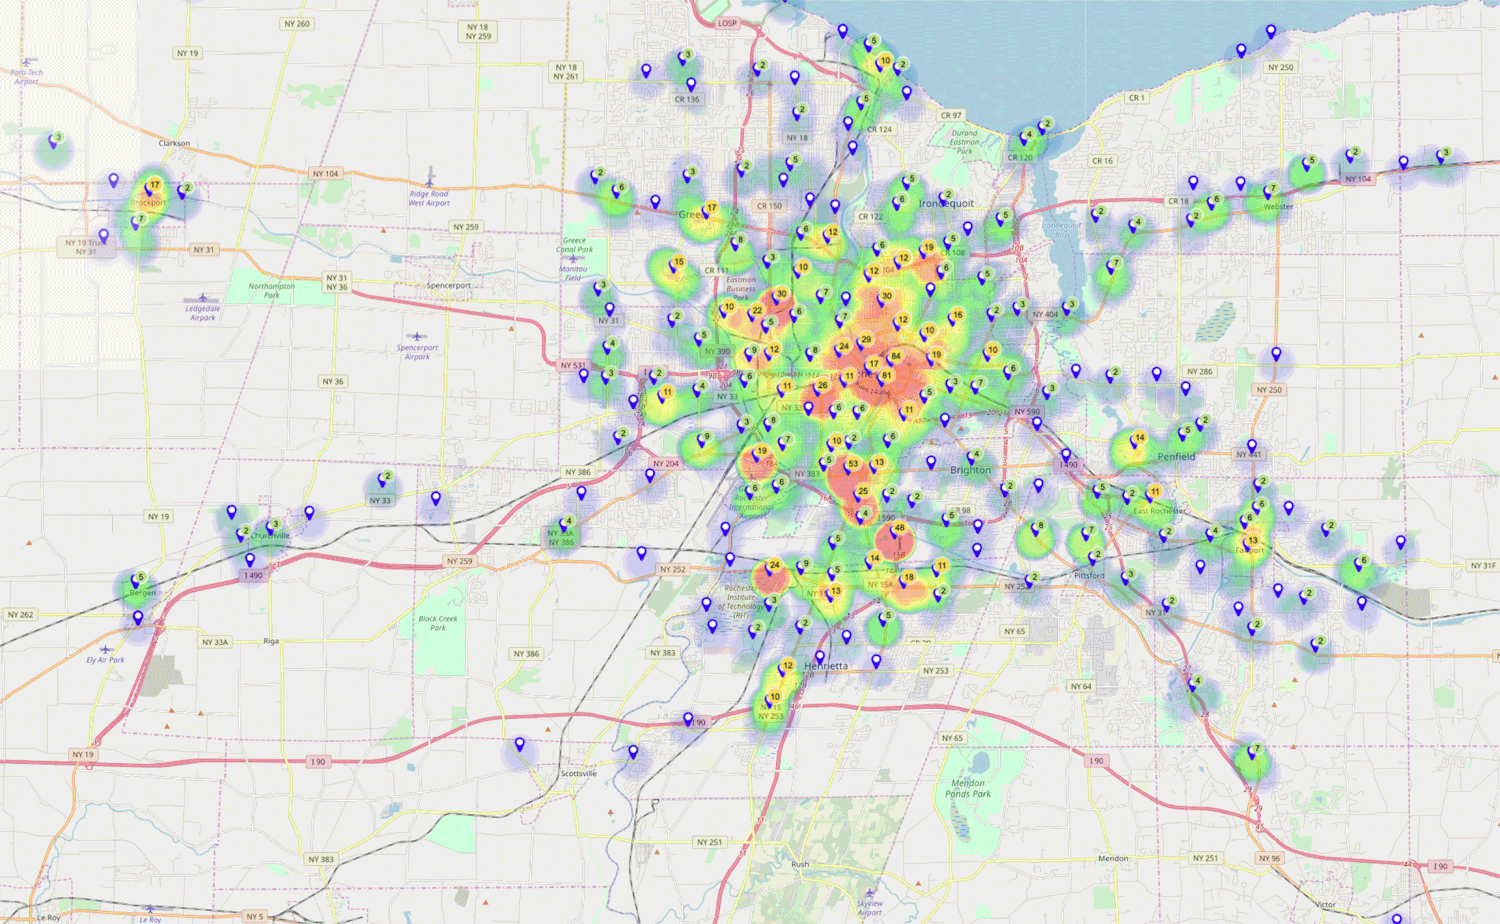
For now, here is the working map with payphone density information I am using to photograph and record my data.